
Hello Everyone,
Let’s continue with the story of Project Manager John and about the Project he is managing for Mr. Smith.
After following the Work Breakdown Structure Technique, John is now ready with the list of activities to be performed in the project and those activities are nothing but the work needs to be done in the Project.
Now, who will do the work, of course Team members, right, but how team members will know when they need to start and finish the activity? Who is doing what? Or what are the deadline?
Well, Stay tuned and Keep Reading !!!
As we are talking about providing the activity details to all team members, it is also important, that everyone in team understands the same information in a unique way, and we do not need to explain differently to different team members.
So the technique I am going to cover today is universally accepted to create the meaningful information about the Project Schedule and this technique is known as “Gantt Charts”. Gantt Charts were invented by “Henry Gantt” in the year 1910, and they are well known in Project Management field for illustrating the Project schedule.
So, Let’s begin learning about Scheduling and Gantt Charts
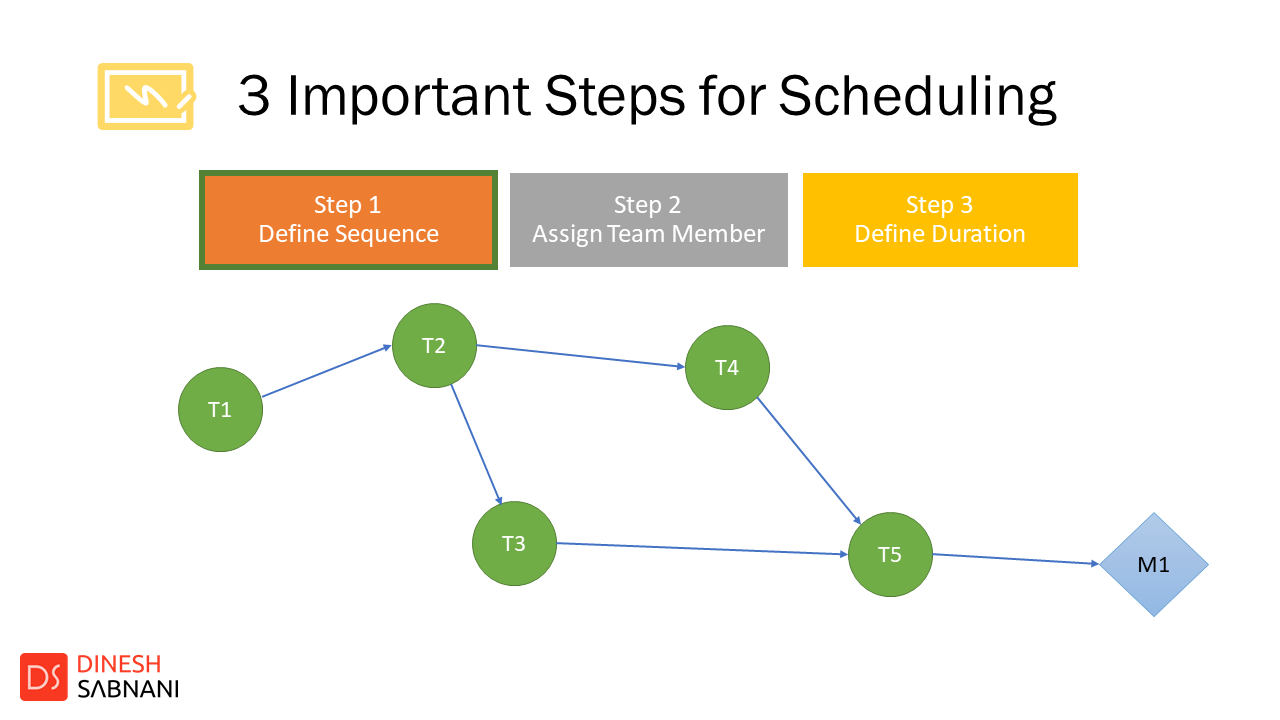
There are 3 important Steps for Scheduling. Let’s look at these steps with the help of the Network Diagram.
Step no. 1 is to define the Sequence of activities ,
In the network diagram, the nodes indicate the Task and Milestones, the tasks are marked as T1, T2 and so on.. And Milestones as M1, M2 and so on.. Here Milestone indicates the completion of the significant series of activities and achieving a desired outcome
Now, connect these nodes with an arrow from one to another to define the sequence of the activities. For example, T2 will be picked up after T1 is completed, T3 and T4 will be picked up in parallel after T2, T5 will be picked up after T3 and T4 are completed and Milestone M1 will be achieved after T5 is completed.
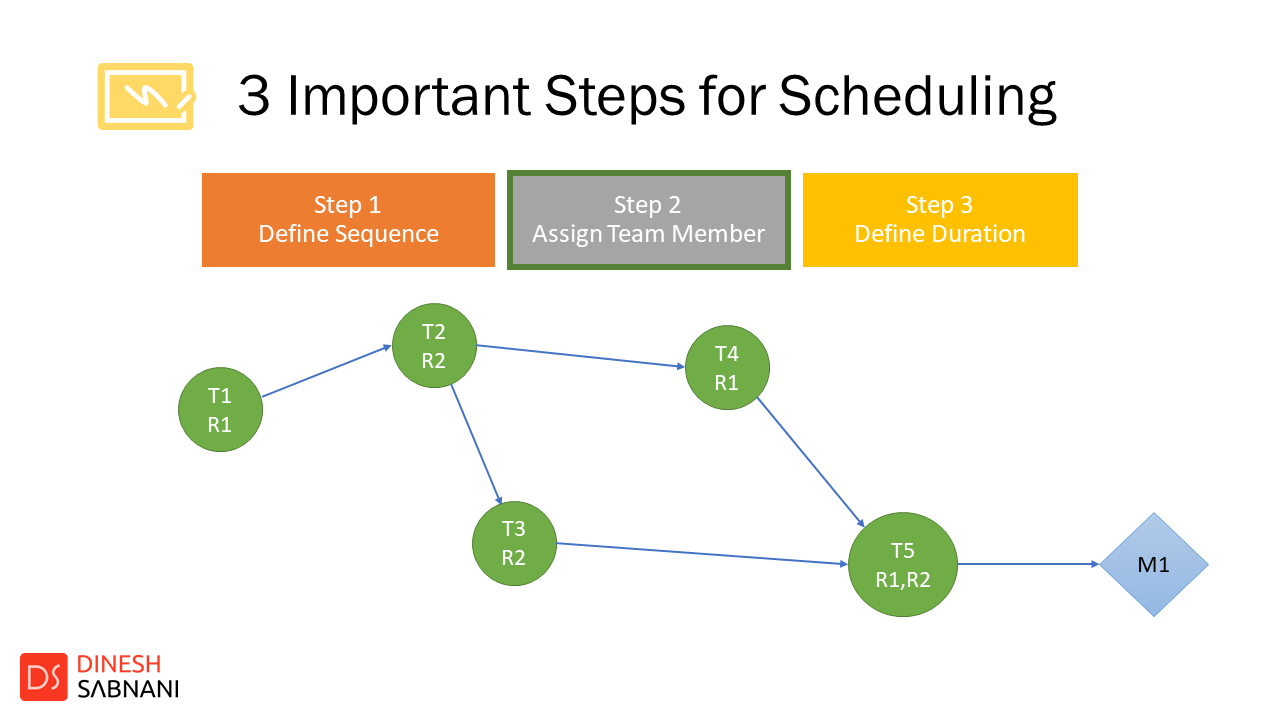
Now, Step no. 2 is to Assign Team members,
Team members or Human Resources indicated in Network Diagram as R1, R2 and so..on are assigned to each task. The resources are the one who will perform the task and complete the work associated with it. The resources are assigned based on their availability and capability to complete the task. For this step, Project Manager can take help of the Subject Matter Expert to match the task with the right capable resource.
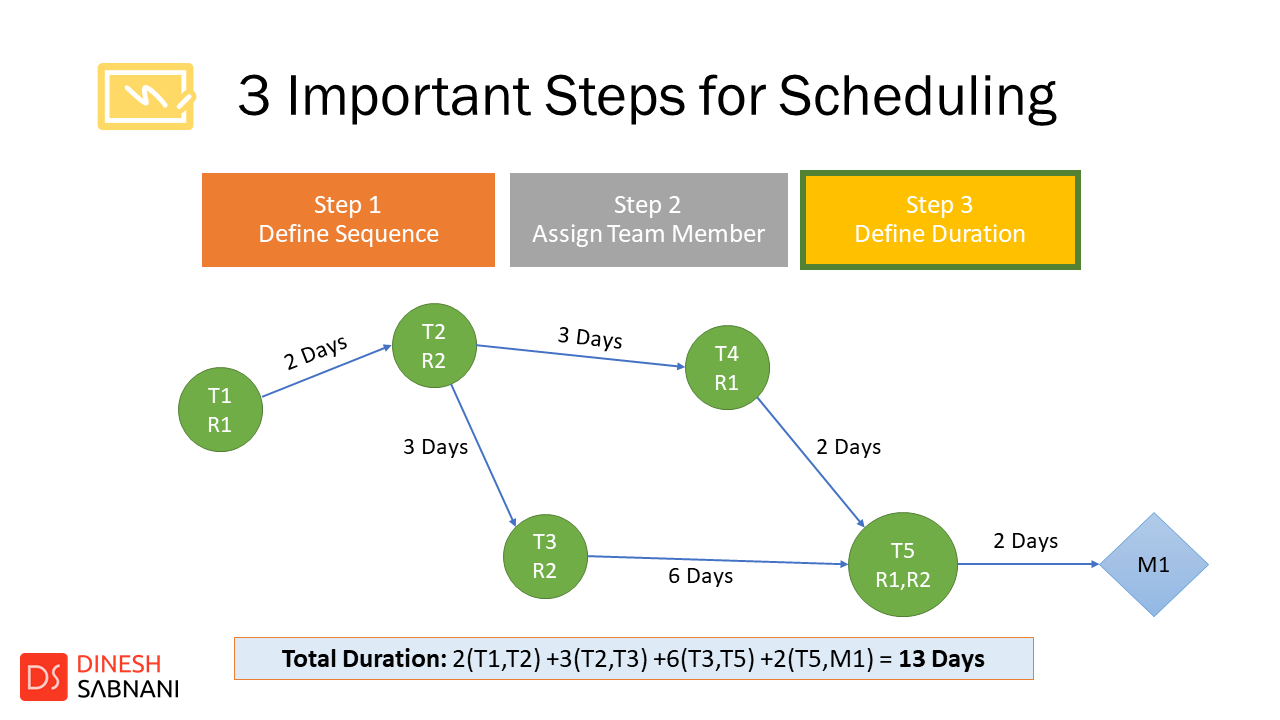
At last, Step no. 3 is to Define Duration,
The Duration in the Network Diagram is shown on the arrows indicating the time required to move from one task to another task or from a task to a milestone. The duration on the arrow also says about the duration required for the preceding task to complete. For example, Let’s say it takes 2 days to move from Task T1 to T2, this also means 2 days is the duration to complete the Task T1.
For this step also, Project manager can take help of the Subject matter Expert to define the duration. Now, Having all the nodes connected with each other and with defined duration of arrows, we can easily make out what will be the total duration of the project. In the example showing here, the total duration is 13 Days by summing the duration of the longest path to reach the next node.
Hope you have learnt something new today, I am sure, you must have realized, these steps are very simple and most of them you already know how to do. The important part is the order of these steps given here.
Like, you should not define duration first and then assign the team member, because what if the team member have not done similar task before and may need more time to do. Duration is defined based on resource capability.
Likewise, do not assign the team member before defining sequence, because if you do not know what comes after another, how will you identify on what task and on what date, the right resource is required.
Now, Let’s see what are Gantt Charts.
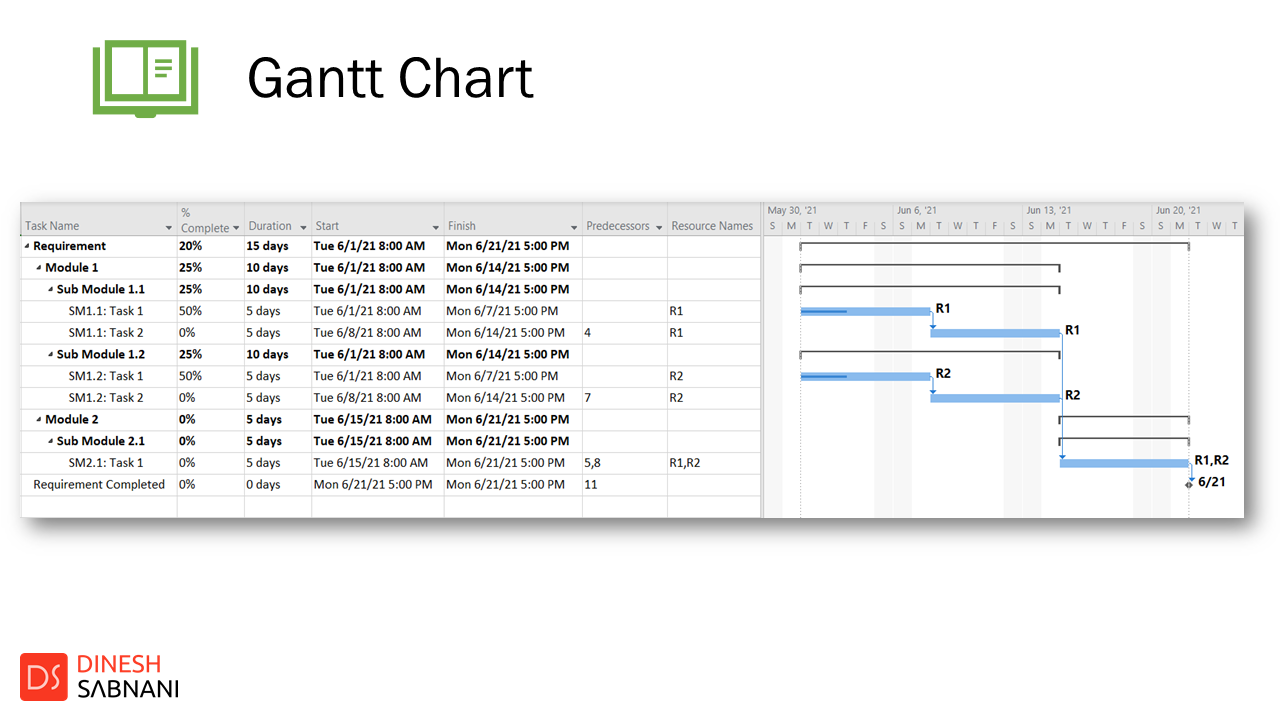
A Gantt chart is a type of bar chart that illustrates a project schedule. This chart, lists the tasks to be performed on the vertical axis, and time intervals on the horizontal axis. The width of the horizontal bars in the graph shows the duration of each activity. Gantt charts illustrate the start and finish dates of the Tasks and Modules. Here, Modules are shown as summary tasks. The Modules and Tasks are taken from the Work Breakdown structure of the project. Gantt charts also show the dependency, having plotted through predecessors relationships between activities. Gantt charts can be used to show current schedule status using percent-complete shadings on the bars.
The Example showing here, is the list of Requirement, Module and Tasks covered in Work Breakdown structure episode and the tasks are sequenced with the help of the Gantt Chart. The Total duration can be seen on the Requirement Summary Tasks as 15 days. The Project start date is 1st June 2021 and End Date is 21st June 2021. This Gantt chart has considered 5 working days in a week and all resources are available full time from morning 8am to evening 5pm.
Gantt Charts are prepared with the help of the Software, the very popular Software to prepare Gantt Charts is Microsoft Project, the earlier versions of MS Project was known as Project Professional.
It’s time for some Action Item:
For this exercise, use the Work Breakdown Structure you prepared in Episode no. 6. First create a network diagram by following the 3 Steps – Define Sequence, Assign Team Member and Define Duration. Convert the network diagram into a Gantt chart using a software for real time tracking.
Finally once prepared, share the schedule with your team and customer for feedback and incorporate the changes. Remember, Feedback is very important, it aligns everyone to be on same page and make sure the schedule is well understood by everyone.
So this was all about Schedule planning with Gantt Charts and our friend John can now use this technique to plan the schedule for the project. I know, John is still worried on how to manage the project budget, The next episode will be on a very interesting technique on planning the budget.
Thank you all, That’s all for this Blog, Have a Great day, Bye Bye.